Have a business presentation coming up that involves geographic data? Ditch the grainy clip art and blurry jpegs. Vector maps in PowerPoint Map Templates are your secret weapon for creating impactful and informative slides that wow your audience.
Here’s why vector maps reign supreme in the world of PowerPoint presentations:
- Sharpen Your Focus: Unlike pixel-based images, vector maps are infinitely scalable. Zoom in on specific regions, highlight city clusters, or showcase your entire sales territory – all without losing image quality. This keeps your message clear and avoids overwhelming your audience with unnecessary detail.
- Dress for Success: Vector maps are like chameleons in the design world. They can be effortlessly customized to match your brand identity. Change colors, add textures, and incorporate your company logo to create a cohesive and professional look that reinforces your brand message.
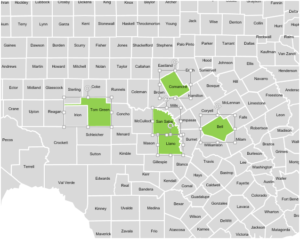
- Data on Display: Transform dry data into a captivating visual story. Use vector maps as a base to layer charts, graphs, and pins to pinpoint key sales figures, customer demographics, or branch locations. This synergy of information makes complex data easily digestible for your audience.
- Informative Storytelling: Maps are powerful tools for illustrating geographic trends and connections. Visually demonstrate the reach of your distribution network, chart the expansion of your franchise locations, or track competitor activity across different regions. A well-crafted map can tell a thousand words.
- Effortless Editing: Vector maps are like Play-Doh for presentations. They can be easily stretched, reshaped, and manipulated to fit your specific needs. Add annotations, highlight specific areas, and create custom callouts to make your point crystal clear.
So next time you’re crafting a business presentation, ditch the low-resolution maps and embrace the power of vectors. With their versatility, scalability, and design-friendly nature, vector maps will ensure your message lands with precision and impact.


