
Leverage the power of vector graphics to create visually stunning and impactful presentations.
When it comes to creating engaging and informative presentations, visuals play a crucial role. While static images and basic charts can convey information, vector maps offer a dynamic and versatile solution to elevate your presentations to the next level.
What are Vector Maps?
Vector maps are digital images composed of mathematical equations that define lines, curves, and shapes. Unlike raster images, which are made up of pixels, vector graphics can be scaled to any size without losing quality or resolution. This makes them ideal for use in presentations where clarity and precision are paramount.
The Benefits of Using Vector Maps in PowerPoint
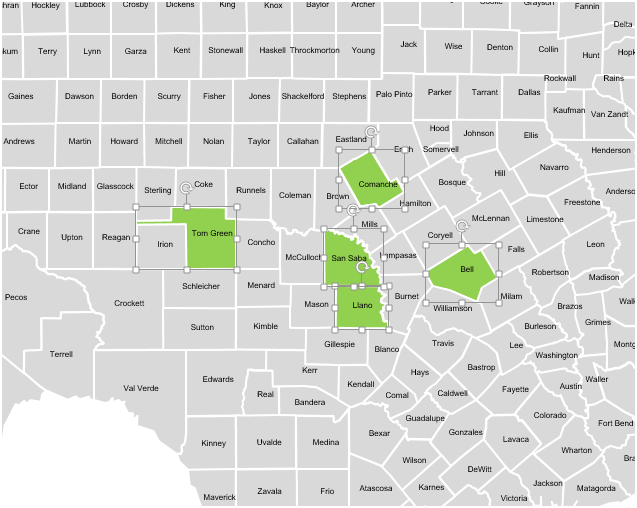
- Customization: Vector maps are highly customizable. You can easily modify colors, add or remove elements, and adjust sizes to suit your specific needs. This flexibility allows you to tailor your visuals to your unique presentation style and message.
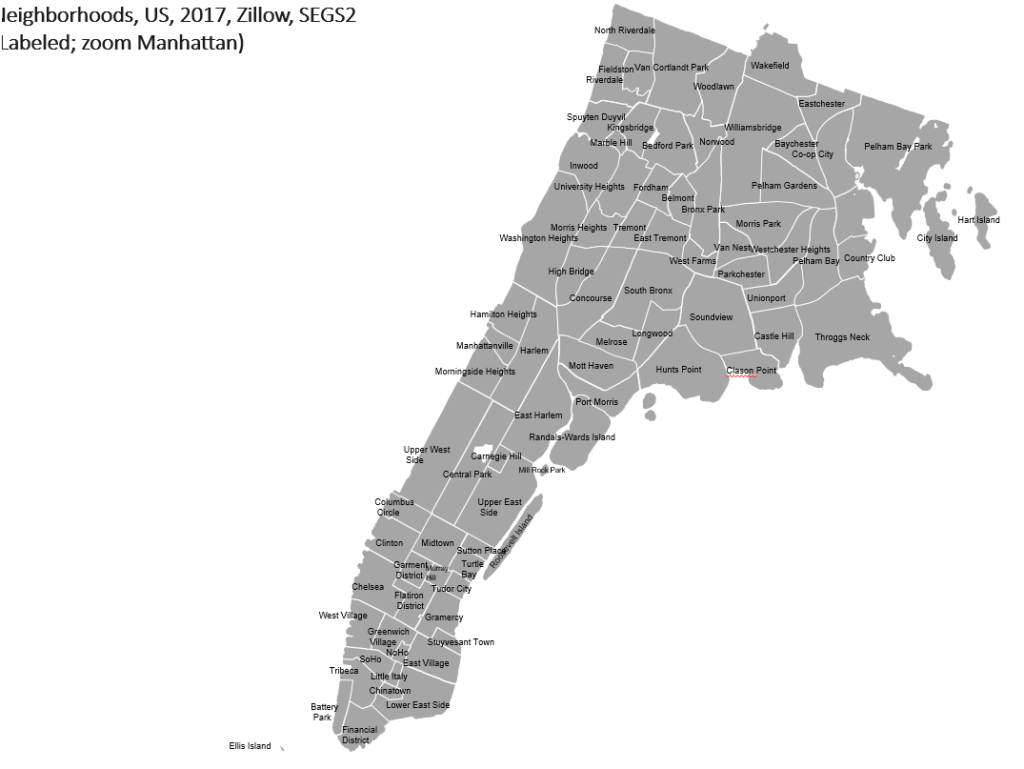
- Clarity: Vector graphics maintain their sharpness and clarity even when enlarged or printed at high resolutions. This ensures that your audience can easily see and understand the information you are presenting.
- Professionalism: Vector maps give your presentations a polished and professional look. They are often used by designers and marketers to create high-quality graphics for print and digital media.
- Efficiency: Vector maps can be reused and repurposed across multiple presentations. This saves you time and effort in creating new visuals for each project.
- Engagement: Visuals are a powerful tool for capturing and maintaining audience attention. Vector maps can help you create visually appealing and engaging presentations that will leave a lasting impression.
How to Use Vector Maps in PowerPoint
- Find Vector Maps: There are many online resources where you can find high-quality vector maps. Some popular options include:
- Wikimedia Commons: A vast repository of free vector maps and other media.
- OpenStreetMap: A collaborative project that creates and provides free geographical data.
- For a custom selection of vector maps designed specifically for PowerPoint, check out PowerPoint Maps (https://powerpointmaps.com/). We offer a wide variety of map styles, from world maps to country and city-specific maps, all optimized for use in your presentations.
- Edit Vector Maps: PowerPoint has built-in tools that allow you to edit vector maps. You can change colors, add text, and even create custom shapes.
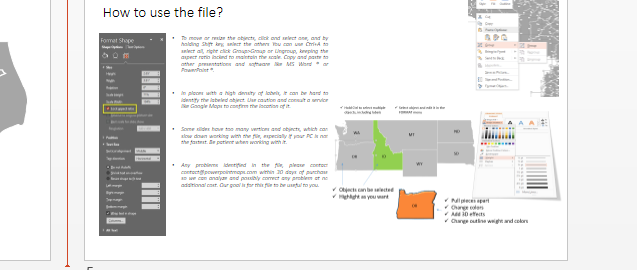
- Use Vector Maps Creatively: Get creative with your vector maps! Use them to highlight key locations, illustrate data trends, or simply add a visual touch to your presentations.
Conclusion
Vector maps are a powerful tool that can help you create stunning and effective presentations. By leveraging their versatility and customization options, you can create visuals that are both informative and visually appealing. So, next time you’re putting together a presentation, consider using vector maps to take your visuals to the next level.