New York City – Neighborhoods in PowerPoint Vector
Original price was: $29.95.$24.95Current price is: $24.95.
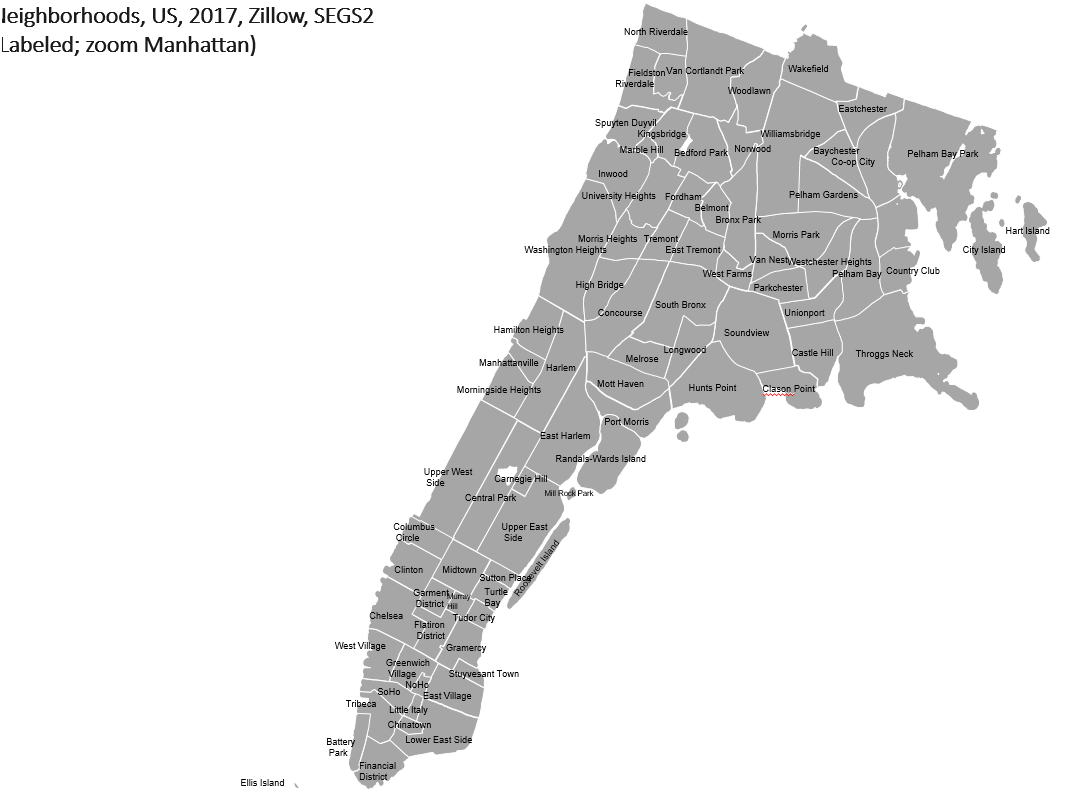
Introducing exceptional vector maps for PowerPoint, crafted to depict the boundaries of New York City’s neighborhoods circa 2017 (Source: Zillow). These vector maps empower you to create impactful presentations that resonate with your audience.
Precision:
- Leverage the power of vector graphics for crisp, clear boundaries that won’t pixelate when scaled.
- Zoom in and out with confidence, maintaining perfect clarity for any presentation size.
Effortless Customization:
- Tailor the map to your specific needs. Change colors, add labels, or highlight specific areas effortlessly.
- Ensure your map aligns perfectly with your presentation’s theme and branding.
Engaging Storytelling:
- Capture your audience’s attention with a visually compelling map
- Communicate geographical data effectively, leaving a lasting impression on your viewers.
Invest in these superior vector maps and elevate your presentations to a whole new level.
Available in editable PowerPoint format for seamless integration into your existing slides.
Download a free sample file clicking here and see how vector maps work
Don’t forget to hit “Enable editing” in your PowerPoint to start editing
![]()
Source: https://catalog.data.gov/dataset/neighborhoods-us-2017-zillow-segs2
Description
Introducing exceptional vector maps for PowerPoint, crafted to depict the boundaries of New York City’s neighborhoods circa 2017 (Source: Zillow). These vector maps empower you to create impactful presentations that resonate with your audience.
Precision:
- Leverage the power of vector graphics for crisp, clear boundaries that won’t pixelate when scaled.
- Zoom in and out with confidence, maintaining perfect clarity for any presentation size.
Effortless Customization:
- Tailor the map to your specific needs. Change colors, add labels, or highlight specific areas effortlessly.
- Ensure your map aligns perfectly with your presentation’s theme and branding.
Engaging Storytelling:
- Capture your audience’s attention with a visually compelling map
- Communicate geographical data effectively, leaving a lasting impression on your viewers.
Invest in these superior vector maps and elevate your presentations to a whole new level.
Available in editable PowerPoint format for seamless integration into your existing slides.
Download a free sample file clicking here and see how vector maps work
Don’t forget to hit “Enable editing” in your PowerPoint to start editing
![]()

Source: https://catalog.data.gov/dataset/neighborhoods-us-2017-zillow-segs2

Reviews
There are no reviews yet.