There are several websites showing how you can use maps that comes built-in in PowerPoint.
Yes, if you’re using the 365 version of PowerPoint, there is a built-in “Map” type that you can use immediately. Even if you’re using an older version or a desktop version that does not include Maps, you can download Microsoft’s templates and insert charts manually with them.
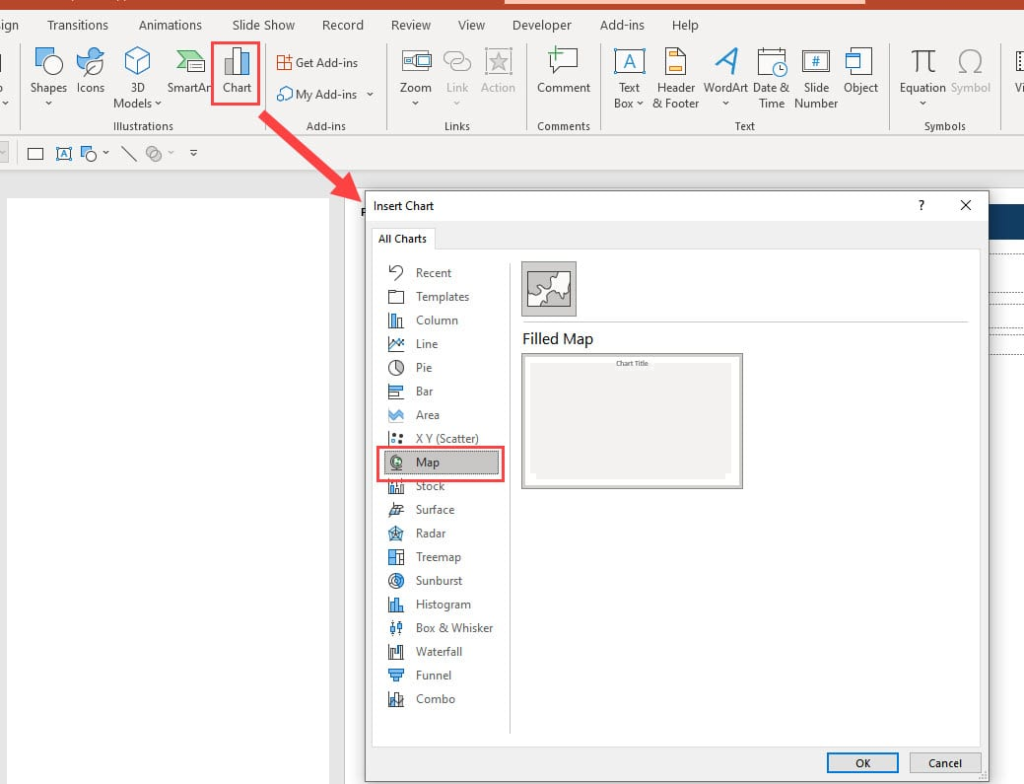
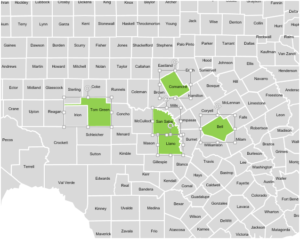
However, you won’t find specific maps in these built-in tools. For instance, you won’t find a customizable vector map with the 118th congressional districts of the US for instance, like the ones you find here in our shop:
PowerPoint offers a world map feature that can be a handy tool for presentations with a global perspective. You can easily insert a basic world map and customize it with colors and labels. However, this built-in functionality is geared towards broad geographical references. For situations requiring more specific maps, like zooming into countries or pinpointing regions and counties, PowerPoint’s default maps fall short. It lacks the detail needed to display intricate borders, like those of congressional districts or neighborhoods, or the ability to showcase specific data tied to smaller locations. In these cases, it’s better to explore alternative solutions like dedicated mapping tools or downloadable maps from reliable sources like powerpointmaps.com.
So next time you need specific maps for your presentations, look beyond what PowerPoint has to offer by default and try our custom designed vector maps that you can customize at will.

